Lowering the barriers
to data insights
Keshif means data made explorable.
Our flagship technology enables 360-degree exploratory analysis with ease and speed. Our solutions bridge the gap between data and action for mission-driven organizations.
Explore our work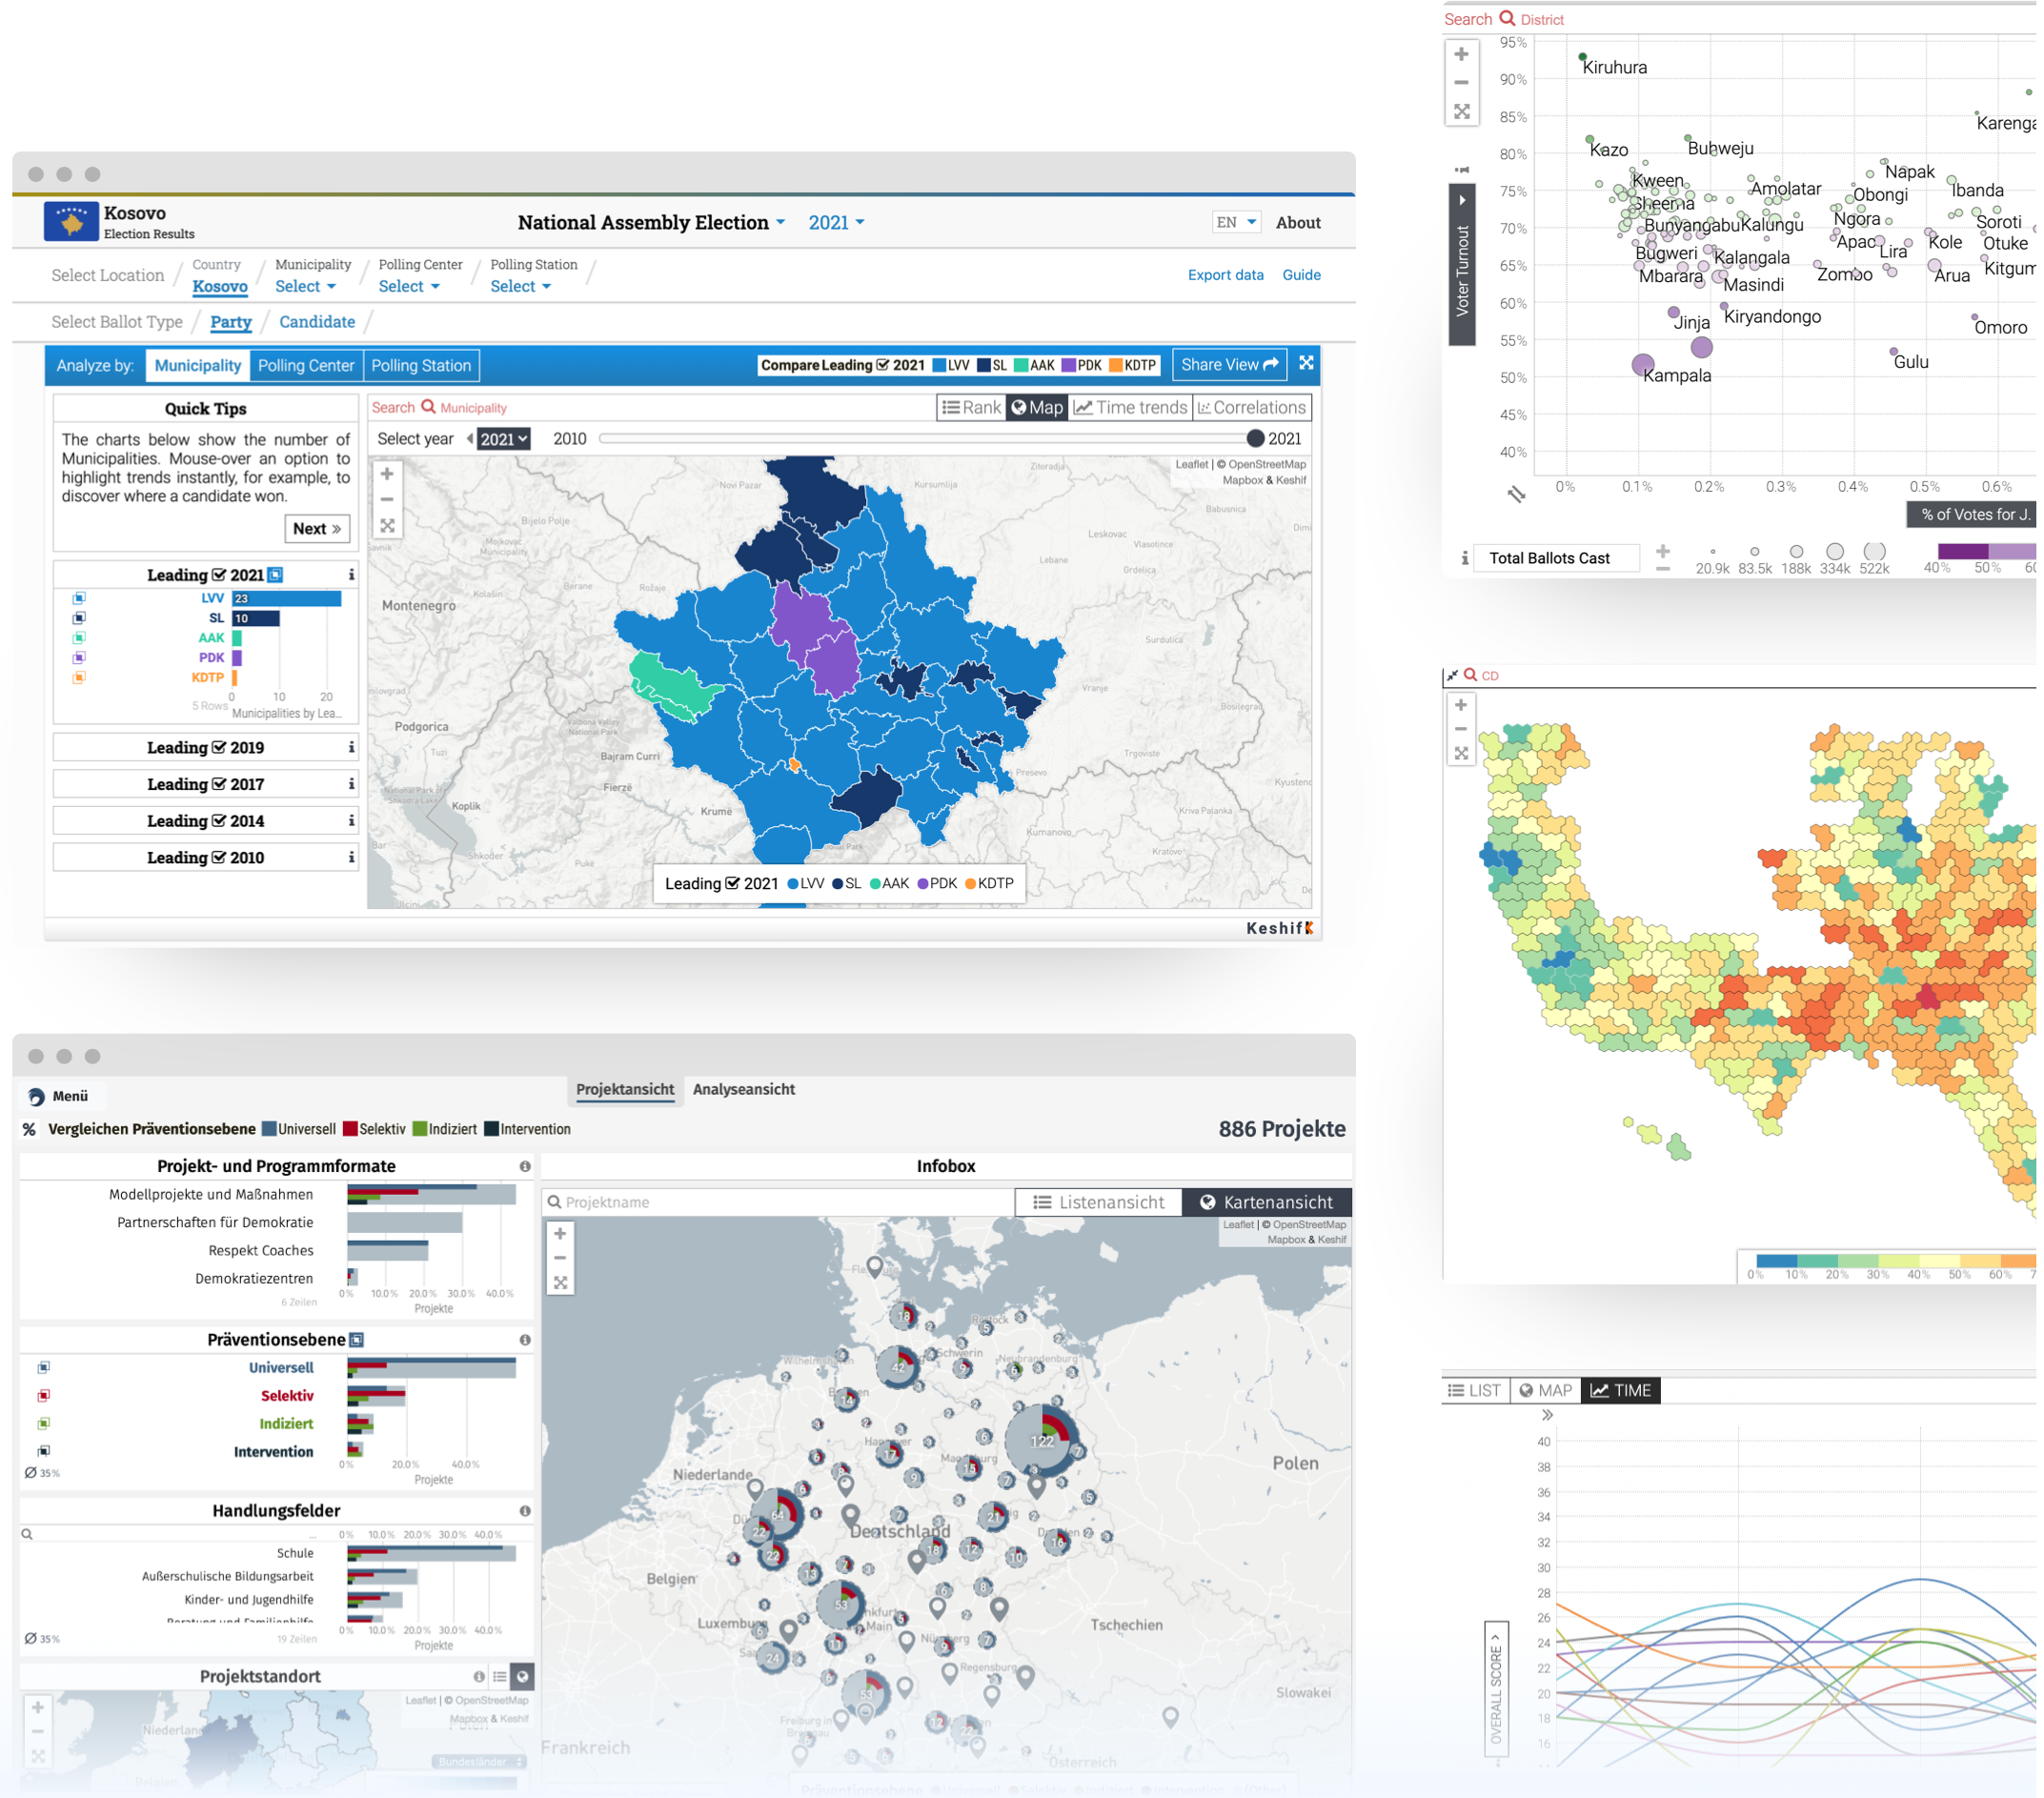
Learn how to visualize and explore data in an instant by creating and controlling rich dashboards and interactive charts with Keshif.
Visit our knowledge base

Our Solutions
Our technology and services adapt across different datasets of many types and sizes. We convert rows and columns of tables and databases into rich, interactive, explorative charts and dashboards. Learn more about our key offerings for datasets we commonly work with in our solutions pages.

Surveys
Your interactive, 360-degree dashboards into analysing what people think.
Learn more

Incidents
Discover the why by visually exploring who, what, when, where & how.
Learn more

Election Results
Elections are the voice of the people. Our solutions bring insight to their voice.
Learn more

Indicators
Explore how data evolves over time, locations, and dimensions
Learn more

Knowledge Management
Collect, organize, and explore data. Transform information to actionable insights.
Services
We solve important data analytics challenges with full-scope, result-oriented application development and advisory services powered by Keshif’s innovative and rapid visual data exploration technology.
Learn more- Visual Data Analytics and Dashboarding
- Data Preparation
- Data Collection
- Data Strategy
- Services Beyond
- Web Design and Development
Sectors
We enjoy working with mission-driven organizations across sectors, and contributing with our technology and expertise to create data solutions that improve the wellbeing of people around the world.
Monitoring, Evaluation & LearningEconomy, Finance & TradeHealthDemocracy & GovernanceStabilization & TransitionDefence
Recent Projects

The International Republican Institute
Visualizing Parliamentary and Local Election Results in Kosovo
Election Results

United Nations Resident Coordinator’s Office
Interactive Repository for Development Reports in Cambodia
Knowledge Management

IREX
Visualizing Indicators of Information Production and Consumption in Eurasia
Indicators
20+ projects
with local and global impact
All Projects

